Summer 2024
Charting the Ottoman Empire
Project Leads: Ali Yaycioglu
The Charting the Ottoman Empire project is an ambitious research initiative exploring the complex financial and political networks of the Ottoman Empire between 1750 and 1850, through the detailed analysis of the fiscal codex MAD 9726. Our work involves building a relational database to uncover intricate connections among actors, networks, and financial systems, utilizing unique Ottoman accounting techniques. This project not only aims to provide new insights into the economic history of the Ottoman Empire but also to refine digital humanities methodologies.
Project Members
Project Team
Ali Yaycioglu
Associate Professor of History
Fatma Oncel
Assistant Professor at Bahcesehir University
Jordan Rothkowitz
Undergraduate Researcher - Summer, 2024
Economic and Political Pathways of the Ottoman Empire through Social Network Analysis
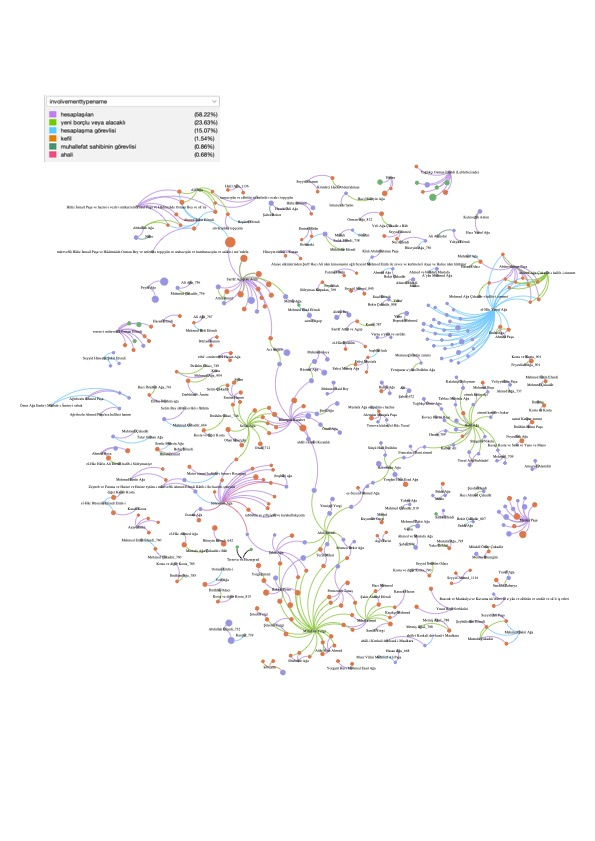
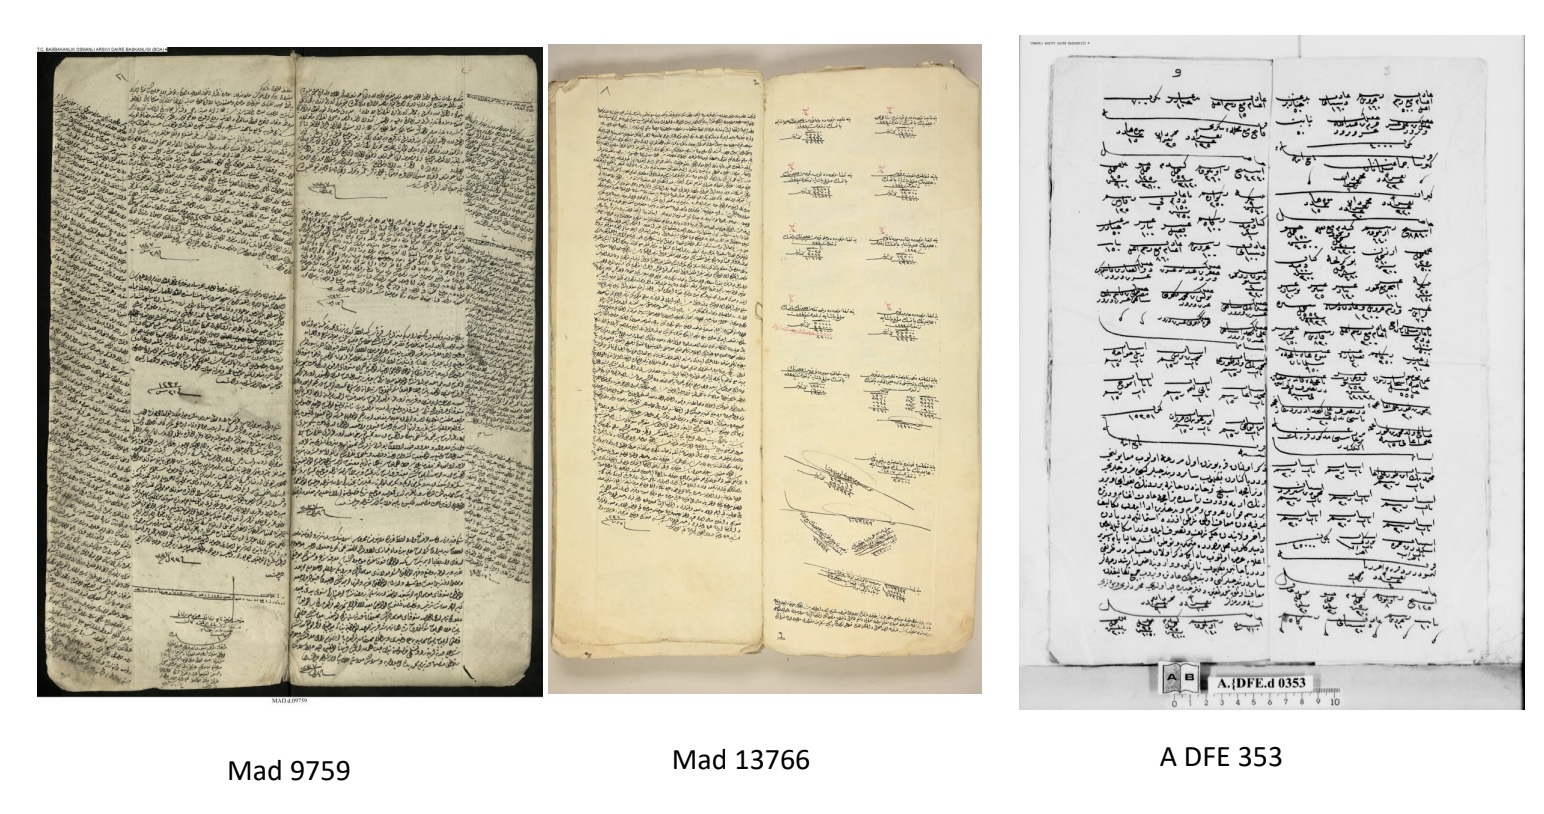
Previous work on the codex MAD9726 by Professor Fatma Öncel and Ezgi Çolakoğlu led to the creation of a relational database in MySQL, which stored the network of financial transactions between individuals or communities and high-ranking political and economic figures in the Ottoman Empire during the early 19th century. When an important figure died, the state took over their assets and liabilities and documented each settlement in the codex. The result of this is a rich network of individuals, institutions, and finances in the empire, complicated by the fact that none of these entities interacted with each other directly; everything is in reference to an asset or liability of the state. My task this summer was to perform a social network analysis on these transactions with the goal of characterizing the structures of political and economic relations within the empire during this time period.
My work began with the completion of the MySQL database for the third inventory owner whose transactions were extracted from the codex. The database in its most complete form consists of roughly 1,400 transactions and 1,000 actors involved in the network. I had to decide next how to build a graph from this database to visualize the relationships between actors.
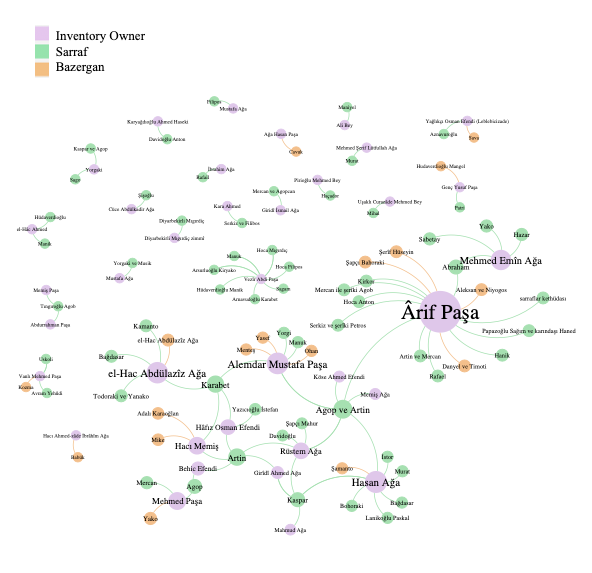
I experimented with Neo4j as a graph database management system but ultimately decided to continue using MySQL and a sequence of queries to create nodes and edges for my graph in tabular form that I then imported into Gephi. Using Gephi, I was able to easily change node and edge size and color based on various properties that we were interested in, such as a person’s financial capacity, their role in a certain transaction, and whether the transaction was a debt or a liability. Gephi also provides the functionality of built-in algorithms for network analysis such as community detection, PageRank, graph density, average path length, and more. The visualizations in this anthology are the result of much experimentation with data visualization, graph structure, and choice and structure of the database, all in consideration of the historical context and economic questions that the lab is interested in.